with(Student[Calculus1]); -1 

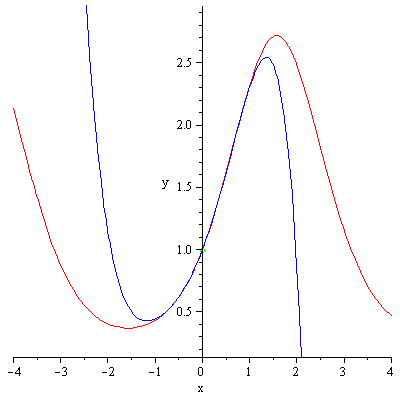
Plot_2dTaylorApproximation(exp(sin(x)), 0, 'view' = [-4 .. 4, .133 .. 2.95], 'order' = 5, 'output' = 'polynomial'); 1 

`+`(1, x, `*`(`/`(1, 2), `*`(`^`(x, 2))), `-`(`*`(`/`(1, 8), `*`(`^`(x, 4)))), `-`(`*`(`/`(1, 15), `*`(`^`(x, 5))))) (1)


`:=`(p5, proc (x) options operator, arrow; sum(`/`(`*`(`^`(-1, k), `*`(`^`(x, `+`(`*`(2, `*`(k)), 1)))), `*`(factorial(`+`(`*`(2, `*`(k)), 1)))), k = 0 .. 2) end proc) 

proc (x) options operator, arrow; sum(`/`(`*`(`^`(-1, k), `*`(`^`(x, `+`(`*`(2, `*`(k)), 1)))), `*`(factorial(`+`(`*`(2, `*`(k)), 1)))), k = 0 .. 2) end proc (2)
 

p5(x) 

`+`(x, `-`(`*`(`/`(1, 6), `*`(`^`(x, 3)))), `*`(`/`(1, 120), `*`(`^`(x, 5)))) (3)
 

expand(`*`(`^`(p5(x), 2))) 

`+`(`*`(`^`(x, 2)), `-`(`*`(`/`(1, 3), `*`(`^`(x, 4)))), `*`(`/`(2, 45), `*`(`^`(x, 6))), `-`(`*`(`/`(1, 360), `*`(`^`(x, 8)))), `*`(`/`(1, 14400), `*`(`^`(x, 10)))) (4)
 

expand(`*`(`^`(p5(x), 3))) 

`+`(`*`(`^`(x, 3)), `-`(`*`(`/`(1, 2), `*`(`^`(x, 5)))), `*`(`/`(13, 120), `*`(`^`(x, 7))), `-`(`*`(`/`(7, 540), `*`(`^`(x, 9)))), `*`(`/`(13, 14400), `*`(`^`(x, 11))), `-`(`*`(`/`(1, 28800), `*`(`^`(... (5)
 

expand(`*`(`^`(p5(x), 4))) 

`+`(`*`(`^`(x, 4)), `-`(`*`(`/`(2, 3), `*`(`^`(x, 6)))), `*`(`/`(1, 5), `*`(`^`(x, 8))), `-`(`*`(`/`(19, 540), `*`(`^`(x, 10)))), `*`(`/`(257, 64800), `*`(`^`(x, 12))), `-`(`*`(`/`(19, 64800), `*`(`^`... (6)
 

sort(expand(`+`(1, p5(x), `*`(`^`(p5(x), 2)), `*`(`^`(p5(x), 3)), `*`(`^`(p5(x), 4))))) 

`+`(`*`(`/`(1, 207360000), `*`(`^`(x, 20))), `-`(`*`(`/`(1, 2592000), `*`(`^`(x, 18)))), `*`(`/`(1, 72000), `*`(`^`(x, 16))), `*`(`/`(1, 1728000), `*`(`^`(x, 15))), `-`(`*`(`/`(19, 64800), `*`(`^`(x, ...
(7)
 

And if you look at the 1st 4 nonzero terms, you see what I got, when I worked this out by hand.  So that's a relief.  I thought, for a minute, there, that the Typesetting:-mrow(Typesetting:-msup(Typesetting:-mi( 's cancelled each other out and I'd have to go to the 4th power (or higher?).   


with(plots); -1 

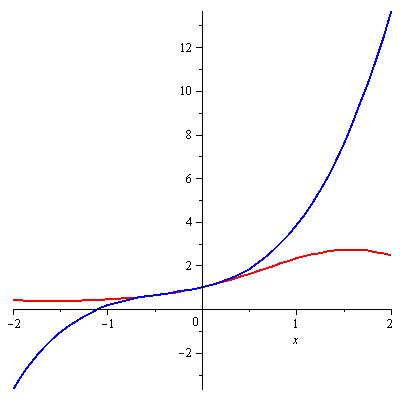
plot([exp(sin(x)), `+`(`*`(`/`(5, 6), `*`(`^`(x, 3))), `*`(`^`(x, 2)), x, 1)], x = -2 .. 2, color = [red, blue], thickness = [2, 2]) 

Plot_2d