An MS Word Version of this document...
I noticed this when I was reviewing my work on the website.
I factored ![]()
![]() is correct. My reasoning from my incorrect factorization is correct, but the final
conclusion is wrong, because it's based on a false premise.
is correct. My reasoning from my incorrect factorization is correct, but the final
conclusion is wrong, because it's based on a false premise.
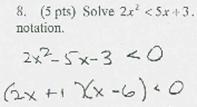
Here's how #8 should go:
From the factorization, we see that the key values of x are the solutions of the equation
We graph these two x–values on the real number line
![]()
This gives us 3 intervals to consider in relation to the
inequality ![]() (which is equivalent
to our original question
(which is equivalent
to our original question ![]() ). These intervals are
). These intervals are ![]() ,
, ![]() , and
, and ![]() .
.
In class, I've been using a graphical argument: Since ![]() is a parabola that
opens up, and we know its x–intercepts,
we can get a rough idea of what it looks like, and reason from the graph to find
the solution set for
is a parabola that
opens up, and we know its x–intercepts,
we can get a rough idea of what it looks like, and reason from the graph to find
the solution set for ![]() .
.

From the rough graph and the intercepts, then, we now see
that, of the three intervals determined by x
= –1/2 and x = 3, only the one in the
middle satisfies ![]() , and so the solution is
, and so the solution is
(–1/2, 3).
I prefer this graphical argument, because it is SO much faster than using test values, and you don't need very much information about the graph to know where it's above the x–axis and where it's below the x–axis, which is the same as answering "> 0" and "< 0" questions.
We'll still do a small amount of test-value stuff, because students seem to like it more, which tells me that there's resistance to actually understanding what's going on. My experience is that if you don't graduate to simple graphical arguments, you're having to think a lot harder and work a lot harder (and slower) than those who are capable of "seeing" the relationship between graphs and inequalities, and I'm not wasting much class time on doing test-values, when it's easy to "see" if you take the time outside of class to learn how.